For Hack4Reno 2013 my team worked with data from the Washoe County Assessor’s office. The entire raw dataset can be downloaded here. You can also follow my team’s work on GitHub.
During the hackathon, we performed some queries on the aggregate data that would be nearly impossible with the existing API. Here are a few that focus on buildings classified as a Single Family Residence. As of November 7, 2013, there were 109,093 of these buildings listed in Washoe county.
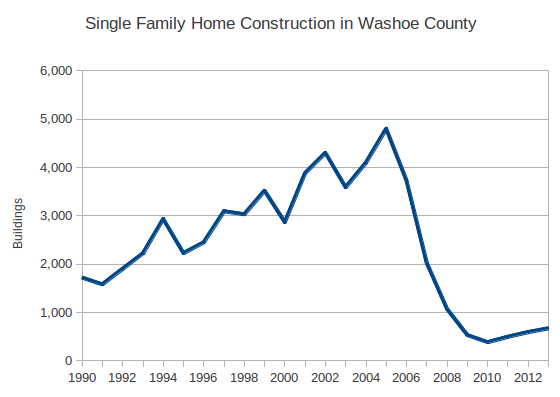
New home construction peaked in 2005 and dropped significantly until 2010. Despite the slight increase in recent years, construction remains at a level not seen since the early 1980s.
| Year | Homes |
|---|---|
| 2000 | 2,868 |
| 2001 | 3,884 |
| 2002 | 4,305 |
| 2003 | 3,590 |
| 2004 | 4,101 |
| 2005 | 4,803 |
| 2006 | 3,732 |
| 2007 | 2,021 |
| 2008 | 1,071 |
| 2009 | 533 |
| 2010 | 385 |
| 2011 | 496 |
| 2012 | 593 |
| 2013 | 672* |
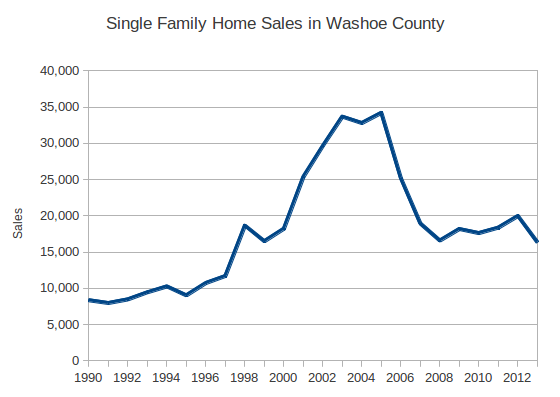
Likewise, sales of single family homes peaked in 2005 and are currently at about 60% of that high.
| Year | Sales |
|---|---|
| 2000 | 18,221 |
| 2001 | 25,376 |
| 2002 | 29,618 |
| 2003 | 33,690 |
| 2004 | 32,798 |
| 2005 | 34,207 |
| 2006 | 25,170 |
| 2007 | 18,935 |
| 2008 | 16,586 |
| 2009 | 18,176 |
| 2010 | 17,621 |
| 2011 | 18,365 |
| 2012 | 19,973 |
| 2013 | 16,353* |
The sale price per square foot of homes underwent a similar decrease. Because of extreme outliers in this query, results were limited to sales less than $1.5 million and homes less than 10,000 square feet. A large number of zero dollar sales were also removed - nearly 50% of the data set.
| Year | Sales | Avg. Ft2 | $ / Ft2 |
|---|---|---|---|
| 2000 | 9,482 | 2,086.2 | 114.88 |
| 2001 | 11,470 | 2,040.1 | 125.13 |
| 2002 | 12,509 | 2,042.7 | 144.73 |
| 2003 | 13,521 | 2,013.0 | 150.01 |
| 2004 | 14,514 | 2,015.0 | 173.45 |
| 2005 | 13,181 | 2,035.6 | 211.91 |
| 2006 | 9,536 | 2,099.9 | 206.74 |
| 2007 | 7,361 | 2,054.9 | 187.37 |
| 2008 | 7,763 | 1,987.9 | 161.71 |
| 2009 | 9,216 | 1,919.0 | 128.02 |
| 2010 | 9,327 | 1,929.1 | 122.30 |
| 2011 | 10,030 | 1,924.9 | 103.78 |
| 2012 | 8,997 | 1,989.2 | 106.62 |
| 2013 | 7,232* | 1,986.4* | 127.71* |
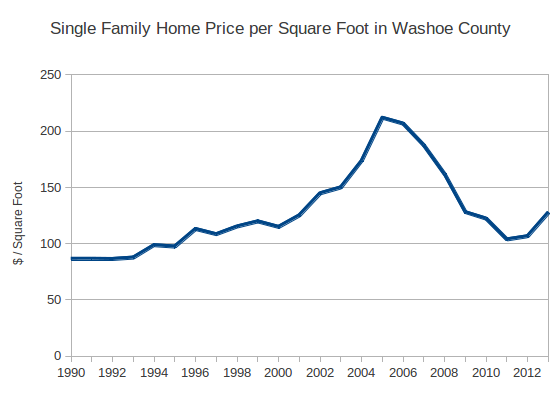
* All 2013 data is year to date.
The queries were performed using the following SQL statements. To find the number of single family homes:
SELECT
    COUNT(buildings.parcel)
FROM buildings
WHERE
    type = 'Single Family Residence'
To produce the table and graph of new home construction:
SELECT
    original_year AS year,
    COUNT(buildings.parcel)
FROM buildings
WHERE
    type = 'Single Family Residence'
GROUP BY 1
ORDER BY 1
For home sales:
SELECT
    EXTRACT(year from sales.date) as year,
    COUNT(sales.id)
FROM sales
    JOIN buildings ON buildings.parcel = sales.parcel
WHERE
    type = 'Single Family Residence'
GROUP BY 1
ORDER BY 1
And the price per square foot:
SELECT
    EXTRACT(year from sales.date) as year,
    COUNT(sales.id),
    AVG(properties.building_sqft),
    AVG(sales.amount / properties.building_sqft)
FROM sales
    JOIN buildings ON buildings.parcel = sales.parcel
    JOIN properties ON properties.parcel = sales.parcel
WHERE
    type = 'Single Family Residence'
    AND sales.amount <> 0 AND sales.amount < 1500000
    AND properties.building_sqft <> 0
    AND properties.building_sqft < 10000
GROUP BY 1
ORDER BY 1